K9s: One of the Best Kubernetes Tools
K9s is a terminal-based UI for interacting with kubernetes clusters. It continuously watches the resources in your cluster and gives you shortcuts for navigating, observing and managing them.
If you work with kubernetes regularly, you probably spend a lot of time running kubectl commands. Get the pods. Describe a pod. Check the logs. Check the events. Find the service. Port-forward the service. Exec into a container. Switch namespace. Repeat.
None of these operations are particularly difficult, but when you are troubleshooting something under pressure, constantly typing commands, copying pod names and switching between terminal windows becomes tedious very quickly.
This is where K9s has become one of my favourite kubernetes tools.
K9s is a terminal-based UI for interacting with kubernetes clusters. It continuously watches the resources in your cluster and gives you shortcuts for navigating, observing and managing them.
For me, it sits in the sweet spot between raw kubectl and a full web-based management interface.
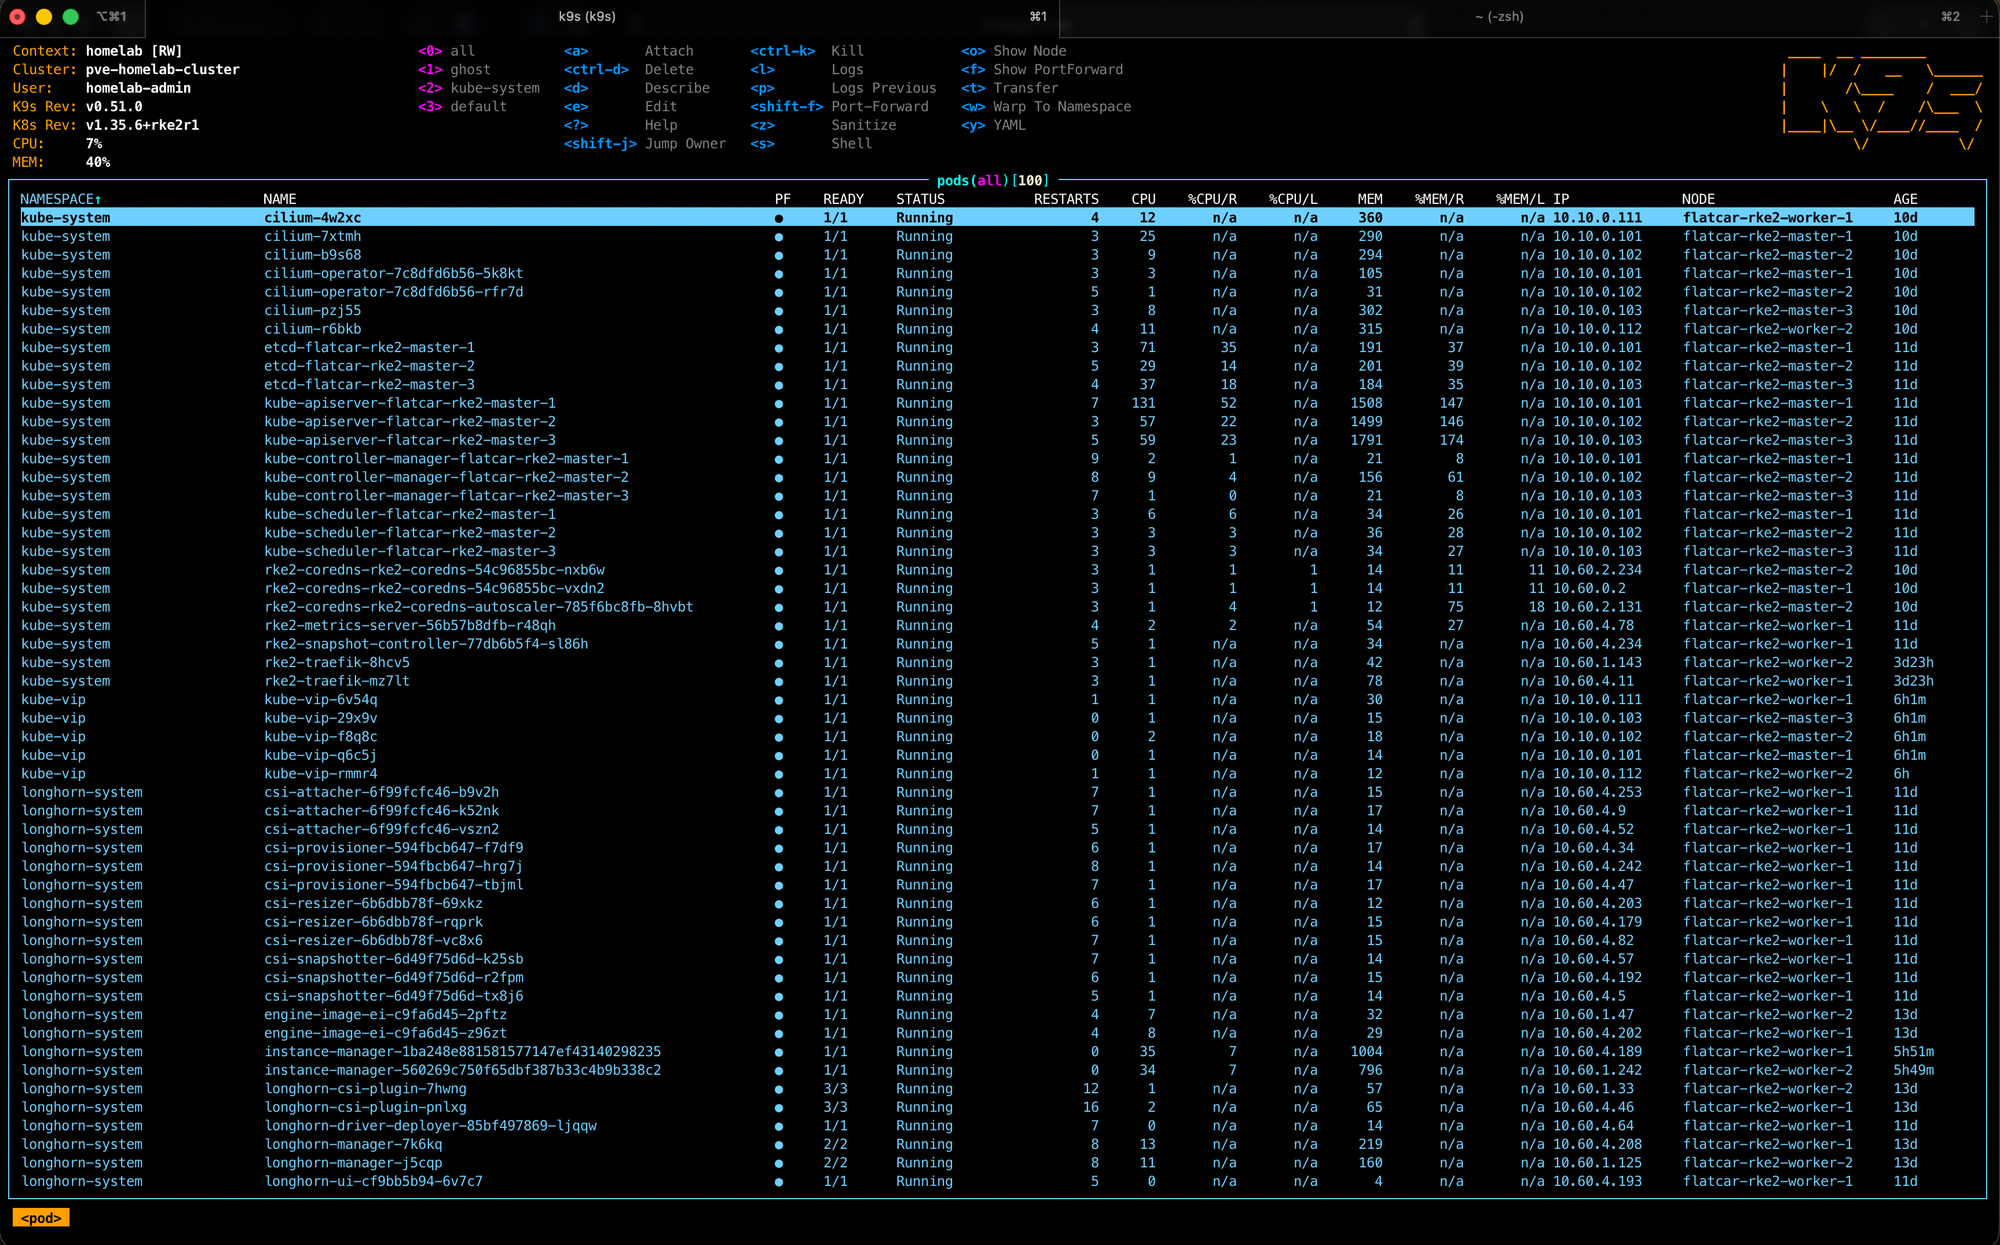
Kubernetes without leaving the terminal
I still believe every platform engineer should understand kubectl.
K9s does not remove that requirement.
What it does is remove a lot of the repetitive work surrounding it.
Instead of repeatedly doing things like:
kubectl get pods -n kube-system

kubectl describe pod cilium-pzj55 -n kube-system

kubectl logs cilium-pzj55 -n kube-system

kubectl exec -it cilium-pzj55 -n kube-system -- /bin/sh
I can open K9s, navigate to the pod and perform those actions directly.
That difference might look small when you are learning kubernetes.
When you manage multiple clusters every day, it adds up.
Finding problems quickly
One of the biggest advantages of K9s is how quickly it gives you a picture of what is happening.
Open the pod view and you can immediately see things such as:
- pod status
- restart counts
- CPU and memory usage
- node placement
- pod age
- containers within the pod
K9s also updates the interface as the cluster changes.
If a deployment is rolling out, I can watch the old pods disappear and the new pods become ready without repeatedly running kubectl get pods.
If something starts crashing, it stands out immediately.
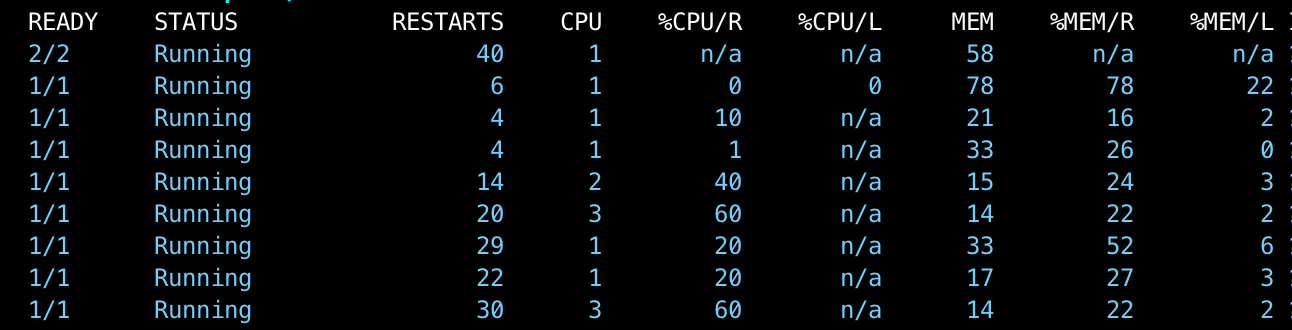
Logs are a couple of keystrokes away
Logs are probably one of the things I use most in K9s.
Select a pod, open its logs and start investigating.
If the pod contains multiple containers, you can select the container you are interested in. You can follow logs as they arrive and search through them without constructing another kubectl logs command.
When troubleshooting an application, removing even a small amount of friction matters.
Instead of thinking about the command I need to type, I can concentrate on why the application is failing.

Describe resources and inspect events
Anyone who has done troubleshooting on kubernetes will eventually end up running:
kubectl describe pod ...
K9s makes describing resources immediate.
The same applies to events.
Scheduling failures, failed mounts, failing health checks, image pull errors and other kubernetes problems often become obvious once you inspect the associated events.
Being able to move between a workload, its pods and the surrounding kubernetes information without leaving the interface makes investigations much faster.
K9s is also not restricted to Pods. It can work with standard kubernetes resources as well as CRDs, which is particularly useful on clusters containing operators and platform tooling.
Getting a shell inside a container
Sometimes logs are not enough.
You need to get inside the container.
With K9s, I can select the pod and open a shell directly without copying the pod name and building a kubectl execcommand.
This is especially useful when checking things such as:
environment variables
mounted configuration
DNS resolution
network connectivity
files inside the container
running processes
It sounds like a small feature, but it is one of those conveniences you quickly miss when it is gone.
Port forwarding without the ceremony
Port forwarding is another excellent example.
Normally I might need something like:
kubectl port-forward svc/my-api 8080:80 -n development
That is perfectly fine.
But with K9s I can navigate to the resource, start a port forward and continue working. K9s even supports configuring default port forwards for workloads where you regularly connect to the same ports.
For local development and debugging internal services, this saves a surprising amount of time.
Navigating a cluster becomes much easier
Kubernetes has a lot of resources.
Pods, Deployments, StatefulSets, DaemonSets, Services, Ingresses, ConfigMaps, Secrets, Jobs, CronJobs, PVCs, Nodes and plenty more.
K9s provides a command interface that makes jumping between them extremely fast.
For example, I can move to Pods, Deployments, Services or Events without remembering a long command or returning to another terminal.
It also works nicely with multiple namespaces and contexts. K9s can be launched against a particular namespace or kubeconfig context, and Kubernetes contexts already bundle the cluster, namespace and user information required to access a cluster.
For engineers managing several environments, that makes moving between development, staging and production considerably less painful.


Pro tip: learn the shortcuts
This is probably the K9s feature I wish more people knew about.
You do not need to type the full Kubernetes resource name every time. Press : to enter command mode and use the resource's short name.
For example: svc for service or deploy for deployments.
Press Ctrl-A inside K9s. K9s will show you all of the resource aliases currently available to you.
It is not just a read-only viewer
K9s can perform plenty of operational actions too.
Depending on your Kubernetes permissions, you can do things such as scale workloads, restart resources, delete resources, manage port forwards and inspect RBAC information. K9s also provides a --readonly mode when you specifically want modification commands disabled.
That last option is particularly useful when working with environments where you want visibility without accidentally changing something.
K9s still respects Kubernetes access controls. It does not magically give you permissions that your Kubernetes identity does not already have.
The real benefit is time
No individual K9s feature is going to save you hours by itself.
The advantage comes from removing hundreds of tiny interruptions.
No copying generated pod names.
No repeatedly specifying namespaces.
No constructing a command every time you want logs.
No opening another terminal just for a port forward.
No typing an exec command simply to get a shell.
No refreshing a dashboard waiting for something to change.
The result is a much tighter feedback loop when operating Kubernetes.
And when you are investigating an incident, deploying a new workload or trying to understand why something is behaving strangely, that faster feedback loop matters.
Final thoughts
K9s is one of the first tools I install when I know I am going to be working with Kubernetes regularly.
It does not hide Kubernetes from you. In my experience, it does the opposite.
You still need to understand Pods, Deployments, Services, namespaces, RBAC, events and the rest of the Kubernetes model. K9s simply gives you a much faster way to move through that model.
For someone learning Kubernetes, I would recommend learning the equivalent kubectl commands first.
Once you understand what is happening underneath, start using K9s.
You will probably wonder why you spent so long copying pod names into your terminal.